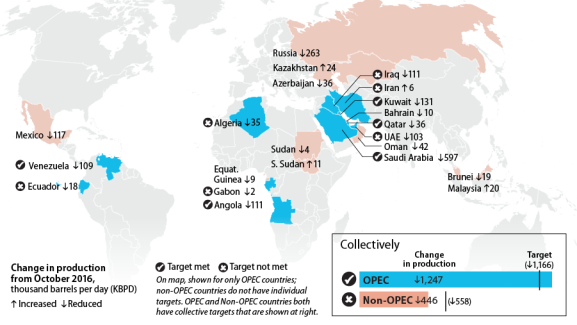
Fig2.1: OPEC and OPEC+ Nations Map, Source: EveryCRSReport
Global energy discussions increasingly focus on transition and sustainability, yet oil remains central to how energy systems, capital flows, and geopolitics function today. To understand this reality, it is necessary to examine the institutions that coordinate oil supply and shape long term investment behaviour.
OPEC is a permanent intergovernmental organization established to coordinate petroleum policies among major exporting countries. Its role is not to maximize production, but to promote market stability by aligning output strategies, managing spare capacity, and signaling long term investment intent. OPEC’s influence lies in coordination rather than production dominance.
A constant concern was the interchangeable use of terminology, hydrocarbons, natural gases, petroleum, oil and more. Frankly, I personally was unable to recollect my high school chemistry courses and had forgotten the distinctions between these terms.
|
Aspect |
Hydrocarbons |
Petroleum (Crude Oil) |
Natural Gas |
Biogas |
Oil (General) |
|
Definition |
Chemical compounds composed of hydrogen and carbon |
Liquid fossil fuel extracted from underground reservoirs |
Gaseous fossil fuel, primarily methane |
Renewable gas produced from organic waste |
Broad term referring to liquid petroleum products |
|
Physical State |
Gas, liquid, or solid |
Liquid |
Gas |
Gas |
Liquid |
|
Origin |
Fundamental chemical building blocks of fossil fuels |
Decomposed marine organisms over millions of years |
Same fossil origin as oil, typically deeper reservoirs |
Anaerobic decomposition of organic matter |
Derived from crude oil through refining |
|
Composition |
Carbon and hydrogen chains and rings |
Complex hydrocarbon mixtures with impurities |
Mostly methane, with ethane and propane |
Methane and CO₂, with trace gases |
Refined hydrocarbon fractions |
|
Production Method |
Not produced independently |
Drilled and extracted, then refined |
Drilled, often co-produced with oil or via fracking |
Produced via anaerobic digestion |
Refined from crude oil |
|
Primary Uses |
Basis for fuels, plastics, and chemicals |
Transport fuels, petrochemicals |
Power generation, heating, industrial feedstock |
Renewable energy and electricity |
Transportation and heating fuels |
|
Environmental Profile |
Depends on application |
High carbon intensity |
Lower carbon intensity than oil and coal |
Low net carbon if managed correctly |
Similar emissions to crude oil |
Petroleum is a broad term encompassing hydrocarbons extracted in liquid and gaseous form. Crude oil is a liquid petroleum product and the primary focus of OPEC coordination due to its global tradability and pricing significance.
Natural gas, while also a hydrocarbon, operates under different market and transport structures and therefore plays a more limited role within OPEC’s framework.
Looking through the global map of OPEC countries, there was a notable difference in nations labelled by either OPEC or OPEC+. After researching more, I realized these classifications were made in the oil markets to differentiate the objectives of different nations.
Do the nations in concern have short term or long-term visions? Are their O&G sector privatized? What is the nature of their petroleum availability and is it capital intensive to extract? What are the foreign relations between these countries and how do they affect trade?
OPEC is a permanent intergovernmental organization with defined membership and long-term objectives centered on oil market stability. Its role is to coordinate petroleum policies among member countries by aligning production strategies, managing spare capacity, and supporting sustained investment in upstream supply.
OPEC+ refers to a broader coordination framework that brings OPEC members together with selected non-OPEC producers through Declarations of Cooperation. Unlike OPEC, OPEC+ is not a standing institution. The agreements underpinning OPEC+ are non-binding but provide structured signaling to markets, allowing producers to respond collectively during periods of supply and demand imbalance.
This institutional distinction underpins the World Oil Outlook’s separation between coordinated and non-coordinated producers. Over the long term, oil supply dynamics are shaped less by resource availability and more by coordination, capital discipline, and investment confidence.
|
Aspect |
OPEC Countries |
OPEC+ Countries |
|
Institutional Status |
Permanent members of OPEC |
Participants in a coordination framework led by OPEC |
|
Coordination Power |
High. Direct influence over collective production policy |
Moderate. Influence through alignment, not control |
|
Market Influence |
Strong ability to shape expectations and manage spare capacity |
Broader reach, but dependent on consensus |
|
Decision Horizon |
Long-term, state-led planning |
Medium-term, conditional cooperation |
|
Pros |
Pricing influence; long-term stability; policy continuity |
Coordination benefits without permanent commitment; enhanced credibility |
|
Cons |
Reduced flexibility; political exposure; stabilization burden |
Limited control; non-binding commitments; coordination fragility |
|
Member Countries |
Algeria, Congo, Equatorial Guinea, Gabon, Iran, Iraq, Kuwait, Libya, Nigeria, Saudi Arabia, United Arab Emirates, Venezuela |
Russia, Kazakhstan, Azerbaijan, Mexico, Oman, Bahrain, Brunei, Malaysia, Sudan, South Sudan |
Reading this, one may wonder, where does the US fit into OPEC? Surely, the US needs to be involved in the global oil trade, especially when there is over USD1.28 trillion worth of crude petroleum traded per year[1].
The US is classified as a non-DoC nation. DoC, standing for Declaration of Cooperation, signals to the world that it will not participate in the coordinated supply of oil supply management.
DoC refers to participation in coordinated oil supply frameworks alongside OPEC members and selected non-OPEC producers. As a non-DoC nation, the United States does not engage in collective production targets or formal coordination mechanisms. Instead, US oil supply is driven by market signals, private capital allocation, and short-cycle investment decisions[2]. What does this mean?
Like much of how US’ industries are structured, oil production is governed by market driven supply and demand. When demand rises and prices are supportive, capital flows into the sector, allowing producers to drill additional shale wells and expand crude output. US shale (O&G produced by natural shale rocks) production is particularly responsive due to its short cycle nature and relatively fast deployment.[3]
However, shale wells decline rapidly, with a large share of production occurring in the early years before falling sharply. Sustaining or increasing output therefore requires continuous drilling, making production heavily dependent on ongoing capital investment. Over time, as prime drilling locations are depleted and decline rates accumulate, maintaining production becomes increasingly capital intensive.
As investor discipline tightens, particularly during periods of price volatility or weaker returns, capital availability contracts. Drilling activity slows, production growth plateaus, and supply tightens. When supply tightens while demand remains stable, the price per barrel rises, as fewer barrels compete to meet existing consumption needs.
This dynamic creates a recurring cycle. Higher prices attract capital and drive production growth, while capital pullbacks lead to reduced drilling, falling output, and renewed price increases. In the absence of coordinated supply management, these market driven cycles translate directly into price volatility.
Since these are cycles, they must be able to be predicted. According to Ray Dalio’s principles of ‘Changing world order’, everything does have a cause and effect, and with enough determinants, one is able to predict the future.
Fig2.2: The long history of oil prices, Source: WEF
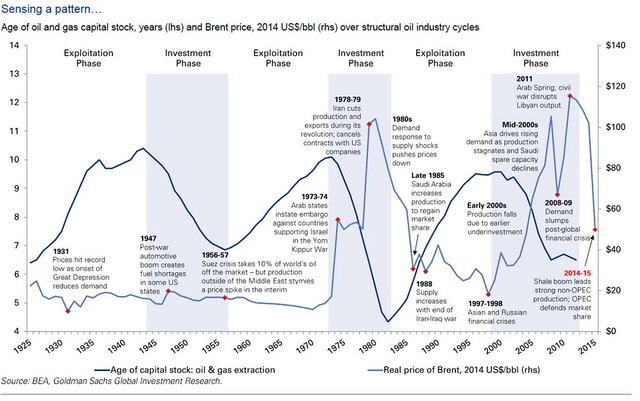
Fig2.3: The Investment and Exploitation phase over the past 100 years in oil trade, Source: BEA, Goldman Sachs Global Investment Research
These two graphs allow us to see the prices of oil over the past 100+ years. The first graph and second graph both highlight the price fluctuations linking to a significant political/economic event in time. The first graphs date all the way back to the 18th century and showcases the link with recessions. The second graph focuses on the exploitation/investment phase, and the inversely proportional relationship between O&G extraction and real price of ‘Brent’ (an index used to benchmark the prices of oil against to understand whether the prices are low are high for oil).
Taking a look at the second graph, oil prices are referenced using Brent crude, the global benchmark derived from a blend of North Sea crude oils. Brent is used as the pricing reference for roughly two thirds of internationally traded crude oil, and prices in markets and contracts are commonly quoted on a per barrel basis against this benchmark. Accordingly, references to the “real price of Brent (2014 US$/bbl)” (2014 US$/bbl means the price in USD per barrel adjusted for the value of money of 2014 so inflation is not noted on the graph) is reflect the inflation adjusted global market price of crude oil and are used as a proxy for overall oil price dynamics rather than country specific production costs. But why are the North Sea crude oils used as a benchmark, over Middle Eastern crude oils or American crude oils?
It’s because of political stability.
The North Sea, consisting primarily of the UK and Norway, has crude oil that is freely traded, politically neutral, and priced in transparent markets, making it a reliable reference point for international oil pricing. In contrast, the US oil was historically restricted form export and was priced in a more domestic market. On the other hand, Middle Eastern oil is usually held by the state, so it is under long term contracts, is usually binded by OPEC policy decisions and is less freely traded.
Let’s break down the correlation between recessions and the crude oil prices in Figure 2.2.
If we compare the 1861 to the 2010s, we can see a decrease in the frequency/recurrences of recessions. This can be due to external factors, both fiscal and monetary policies that are developed by government nations to combat potential global recessions.
Recessions and oil prices interact through two distinct mechanisms: demand driven shocks and supply driven shocks. In a nutshell, demand driven shocks cause recessions to lead oil prices lower through reduced consumption, while supply driven shocks cause oil prices to rise first and can contribute to recession by increasing costs and weakening economic conditions.
In demand driven recessions, economic activity contracts first. Industrial production slows, transportation demand falls, and consumer spending weakens, leading to a decline in oil consumption. Because oil demand is closely tied to economic output, this reduction in demand places downward pressure on oil prices. In these cases, falling oil prices are a consequence of recession, as seen during the Great Depression and the Global Financial Crisis.
In contrast, supply driven oil shocks originate within the oil market itself. Sudden disruptions to supply, such as geopolitical conflicts, embargoes, or production outages, sharply reduce available oil. This causes oil prices to rise rapidly, increasing energy costs across the economy. Higher fuel and input costs raise inflation, reduce disposable income, and compress business margins. When these pressures become severe, they can slow economic activity and contribute to the onset of recession. In this case, rising oil prices act as a trigger rather than a result of economic downturn, as observed during the oil shocks of the 1970s (from the Arab Oil embargo and the Iranian Revolution).

It took me some time to understand this; I’ve generated an infographic with AI to better break this down.
Fig1.2: Demand driven recession versus supply shocks, Source: AI
The next time you see an embargo on a certain nation on the news, or the fact that a certain country will be lowering their economic output; it is now possible to track what could potentially happen in the oil markets.
Moving on to the next Figure 2.3, we can explore
a) The relationship between investment and exploitation phases
b) The link between O&G extraction and the real price of Brent
Initially, it took me some time to understand the investment and exploitation phases. However, a great analogy to the I/E phases in the oil market is, well, farming.
Farmers, in times of food scarcity, plant more seeds in hopes that the seeds would sprout and provide crops over a larger time horizon. This is the exact same for drilling oil wells. Returns are not immediate, but they are predictable. When the seed grows to a crop, that’s when farmers can harvest the plentiful seeds they have planted. This is when exploitation occurs. There is no need to plant more seeds when there are enough crops to go around. Nevertheless, over a period, the crops are all harvested, and there is food scarcity once more. This is similar to the cycle of oil drilling and oil pumping, linking back to investing and exploiting.
Now, let us look into the link between O&G extraction and the real price of Brent.
On the graph, we can see an inversely proportional relationship between the real price of Brent and O&G extraction. In essence, the price of Brent will be low when there is more supply from the O&G extraction. The price of Brent will be high when there is a decreased supply from the decreased O&G extraction.
Abundant supply reduces competition for barrels, placing downward pressure on prices. In these periods, Brent prices tend to be lower because producers are drawing heavily on existing capacity.
Conversely, when extraction levels are constrained, often due to underinvestment, ageing fields, or supply disruptions, oil becomes relatively scarce. When demand remains stable or rises, fewer available barrels push prices higher. Brent prices increase to ration limited supply and incentivize future investment.
This inverse relationship is reinforced by investment lags. High prices usually signal that supply is tight, which encourages new investment. However, because new production takes years to come online, extraction remains low in the short term, keeping prices elevated. Once investment delivers new capacity, extraction increases and prices decline.
As a result, Brent prices rise when extraction capacity is insufficient and fall when extraction is abundant, creating an inverse relationship over the cycle rather than a smooth adjustment.
Going back to DoC and non-DoC structures, participating as a non-DoC allows the US producers to respond rapidly to price changes and innovate efficiently, but it also exposes supply to greater volatility and capital cycle sensitivity.
In contrast to DoC producers, which prioritize long-term stability and coordinated investment, non-DoC producers operate as price takers. Their production growth depends less on strategic alignment and more on investor confidence, resource quality, and near-term economics. This distinction explains why US supply has expanded rapidly in favourable conditions yet is projected to plateau as capital discipline and resource depletion constrain long-term growth.
Knowing the US to be a global leader and setting a precedent in every industry present, it is quite unusual to not see them leading such a large organization. However, the US cannot credibly participate in a DoC framework because oil production is not controlled by the government.
US oil is produced by private companies, shareholder funded capital, and market-based investment decisions. Which means that the government cannot mandate production cuts or increases. Furthermore, coordinated supply management would conflict with competition and antitrust laws, and production would respond to prices, not policy.
As a result, the US functions as a price responsive producer rather than a price coordinating one. Its system favors speed, innovation, and short cycle growth, but at the cost of long-term supply stability.
OPEC World Oil Outlook 2025
- Global oil industry investment requirements are estimated at USD 18.2 trillion through 2050, largely to offset natural decline and meet rising demand.
- Global population is projected to grow by 1.5 billion, reaching 9.7 billion by 2050, with the working-age population increasing by 800 million.
- Global urbanization is expected to rise from 58% to 68%, implying 1.9 billion additional urban residents by 2050.
- The global economy is projected to more than double, expanding from USD 171 trillion in 2024 to USD 358 trillion by 2050 (2021 PPP), with average income rising from USD 21,000 to USD 37,100.
- Non-OECD economies are expected to drive most of the population growth and economic expansion.
- Oil demand is projected to increase by 18.2 mboe/d (million barrels of oil equivalent per day), while natural gas demand rises by 20 mboe/d by 2050.
- Nuclear energy demand is expected to grow by 10 mboe/d, following a prolonged period of stagnation.
- Coal demand is projected to decline by 30.4 mboe/d due to policy pressures and fuel substitution.
- Oil is expected to retain the largest share of the energy mix, at just under 30% by 2050, while oil and gas together remain above 50% throughout the period.
- The share of other renewables in the energy mix is projected to rise to 13.5% by 2050, an increase of 10 percentage points from 2024.
- Global electricity generation is expected to increase from 31,500 TWh in 2024 to 57,500 TWh (Terawatt hours) by 2050.
- For context, 1 TWh equals the electricity consumed by a large city for a year.
- 75% of electricity demand growth is expected to come from developing economies, with 60% from developing Asia.
- Electricity generation from wind and solar is projected to increase from 4,900 TWh to 26,000 TWh by 2050.
The OPEC World Oil Outlook 2025 raises important questions beyond headline demand growth. If global energy demand continues to rise by around 23% by 2050, largely driven by population growth and rising incomes in developing economies, how does this reconcile with sustainability goals and climate commitments? The outlook suggests that the energy transition is unfolding in a world where total energy needs are still expanding, not contracting. This raises a fundamental tension between climate ambition and the practical realities of meeting energy demand for billions of people entering more energy intensive lifestyles.
While renewables and electricity generation are scaling rapidly, oil and gas remain embedded in the system, together accounting for more than half of total energy demand through 2050. This naturally leads to questions around timing and cycles. If oil continues to play such a central role, what happens if investment fails to keep pace with demand? OPEC’s estimate of USD 18.2 trillion in required oil industry investment highlights that much of this capital is needed simply to offset natural decline in existing fields. Without it, supply tightens.
In January 2025, I had the opportunity to meet with Matthieu Pinet, a Wealth and Asset Management Advisor in Europe and MENA (ex-KPMG Luxembourg). Now that I recall, we had met exactly one year ago today discussing OPEC and the amount of capital required to push the needle on extracting our current oil reserves. He had used a simple analogy.
If you double 0.1, you get 0.2. Double 0.2, and get 0.4. Double 0.4, and get 0.8. Double 0.8, and you cross 1 to reach 1.6.
Imagine these arbitrary units as measurements of the oil present on our planet. If we want 0.1AU of oil, we need to drill down deeper into the crust of the Earth. He noted something very important; the jump from 0.8 to 1.6 would need the most drastic drilling technology to extract oil.
The real question is, is it more valuable to find the investment to drill deeper into the reserves to extract more oil, or to find more potential reserves globally to develop infrastructure for, such as Pakistan (potentially).

Image: Meeting with Matthieu Pinet
This title might be confusing. It might sound more plausible for it to be UAE-US Oil Trade Deal, or Pakistan-US Nuclear Trade Deal; but oil? Pakistan is only the 52nd largest producer of oil, with only 0.014% of the global share. [4]Why would the US be in Pakistan for O&G?
According to SAMAA TV (Pakistan’s National News channel), Mari Petroleum Company has announced the discovery of a significant new oil and gas reserve in North Waziristan.
According to the company’s statement, the discovery was made at the Sampwam-1 well in Hangu district. Initial estimates suggest that the newly found reserve has the potential to produce 20 million cubic feet of gas per day. Additionally, the well is expected to yield 122 barrels of crude oil daily. Some estimates suggest that this discovery constitutes the fourth-largest oil and gas reserves in the world.[5]
Despite all of this findings, oil is Pakistan's largest import item, accounting for nearly 20% of Pakistan's total import bill, according to central bank data[6].
What makes this development particularly compelling is the scale of the upside if exploration proves successful. Some preliminary assessments and historical surveys suggest that Pakistan’s offshore and onshore basins, particularly in Balochistan and the Indus region, may be materially underexplored relative to their geological potential. While claims that Pakistan could become the fourth largest oil and gas reserve holder remain speculative and unproven, the fact that such upside is even discussed highlights the asymmetry of the opportunity.
From a strategic perspective, this is less about immediate production and more about optionality. For the United States, engagement in Pakistan’s energy sector provides long-term positioning in a strategically located country at the intersection of the Middle East, South Asia, and China’s trade routes. For Pakistan, US participation diversifies external partnerships, introduces advanced exploration capabilities, and improves the credibility of its energy sector at a time when global investment is increasingly selective.
Even if commercial discoveries take years to materialize, the deal itself is significant. It places Pakistan back into the global energy conversation and underscores how, in an environment of rising long-term energy demand and constrained investment, frontier and underexplored regions can rapidly regain strategic relevance.
[2] https://www.opec.org/declaration-of-cooperation.html
[3] https://www.gisreportsonline.com/r/shale-oil/#:~:text=At%20the%20heart%20of%20that,%C2%A9%20GIS
[4] https://www.worldometers.info/oil/pakistan-oil/#:~:text=Oil%20Reserves%20in%20Pakistan%20(2025,(at%202024%20consumption%20levels)